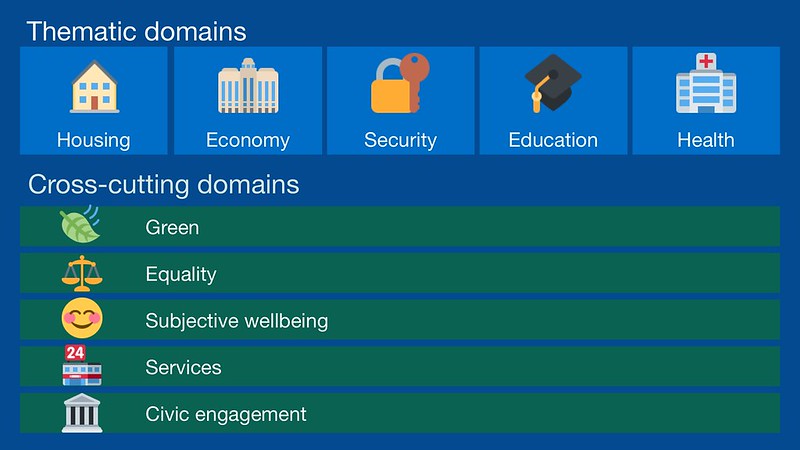
Methodology
Metrics
Housing — An ideal community is one where there is a full range of housing available for its citizens...
- Additional affordable homes provided as a percentage of all net additional homes
- Households assessed as homeless per thousand (Annual)
- Vacant dwellings - all, as a percentage of all dwellings in the area
- Ratio of median house price to median gross annual (residence-based) earnings
Economy — ...with an economy that sustains high levels of employment for all and allows for sufficient leisure and down-time activities...
- Percent of people of working age who are unemployed
- Proportion of population aged 16-64 qualified to at least Level 4 or higher
- Rate of births of new enterprises per 10,000 resident population aged 16 and above
Security —...where people feel secure and free from crime and the fear of crime...
- Juvenile first time entrants to the criminal justice system per 100,000 of 10-17 year olds
- Violence against the person - with injury (offences per 1,000 population)
- Criminal damage and arson (offences per 1,000 population)
Education — ...where its citizens benefit from an education system which ensures all achieve their fullest potential...
- Proportion of 16 year olds who were not in education, employment or training (NEET), or their activity was not known
- Average Attainment 8 score
- Percentage of pupils reaching the expected standard at the end of key stage 2 in reading, writing and mathematics
Health — ...and where everyone has the best possible health.
- Life expectancy at birth - male
- Life expectancy at birth - female
- Healthy life expectancy at birth - male
- Healthy life expectancy at birth - female
- Doctors/GPs per 1000 people
Green — The most successful communities would be able to achieve all of the thematic domains in a way that is green and sustainable over the short and long term...
- Percentage of household waste sent for reuse, recycling and composting (annual)
- Carbon dioxide emissions estimates - Domestic per capita
- Carbon dioxide emissions estimates - Total per capita
Equality — ...which reduces the inequalities in outcomes...
- Median gross annual pay of employees by residence (resident base)
- Proportion of children aged 0-15 in relative low income families
- Income Deprivation Affecting Older People Index (IDAOPI) - score
- Percentage of all pupils eligible and taking free school meals
Wellbeing — ...in a way that leaves citizens feeling subjectively better...
- Average (mean) rating to the question "Overall, how satisfied are you with your life nowadays?"
- Average (mean) rating to the question "Overall, to what extent do you feel the things you do in your life are worthwhile?"
- Average (mean) rating to the question "Overall, how happy did you feel yesterday?"
Services — ...where suitable services are readily available to its citizens...
- Mortality rate from causes considered preventable per 100,000 population (2019 definition)
- Barriers to Housing and Services - score
- Percentage of adults aged 16+ who are active (150+ minutes a week)
Civic engagement — ...and where citizens feel they are engaged in the civic life of the city and in its governance.
- Percentage of overall turnout for local elections
- Percentage of adults aged 16+ who have volunteered to support sport and physical activity at least twice in the last 12 months
- Council tax collected as a percentage of council tax due
Methodological note
The ten categories were established based on a comprehensive literature review of existing literature and the growing number of published measures. For each category, a statement that describe an ideal community was created, and a range of metrics were identified for each. The composite liveability measure uses a statistical approach to combine the metrics for each category. Each metric is equally weighted and standardised using z-scores to achieve a composite score (higher is better).
Steps
- The raw data values for each metric are collected. Missing data points are assigned a value based on the nearest available data point (e.g. a district may take the average value of all the other districts in the county).
- Allocate a direction to each metric. For instance, additional affordable homes is positive (more affordable homes is better), while violence against the person is negative (less violence is better).
- Standardise each metric using z-scores, so that they are equally comparable.
- For each category, sum the metric z-scores for each local authority. This results in one data point for each category for each local authority.
- The sum of the Z-scores is then assigned a percentage rank, giving an indication of how each local authority performs against another at a category and overall level.
Z-scores
A z-score shows how far a number is from the average. They are useful for the composite liveability measure because when raw scores are transformed into z-scores, they can be added together to compare raw scores with different distributions.
It is calculated by:
z = ( x - μ ) / σ
A z-score of 0 shows that a number is at the average. The further away the z-score is from 0, the further away it is from the average. A positive z-score means it is above the average, and a negative one means it is below the average.
The z-score demonstrates the number of standard deviations from the mean. For a set of numbers, the mean is their average value, and the standard deviation shows how spread out the set of numbers are. The z-score locates where a number is based on the standard deviation, and shows the position of the number as compared to the average.
Insight
Address: Coventry City CouncilPO Box 7097
Coventry
CV6 9SL


